top of page

Power BI
Empowering Decisions Through Interactive Data Visualizations
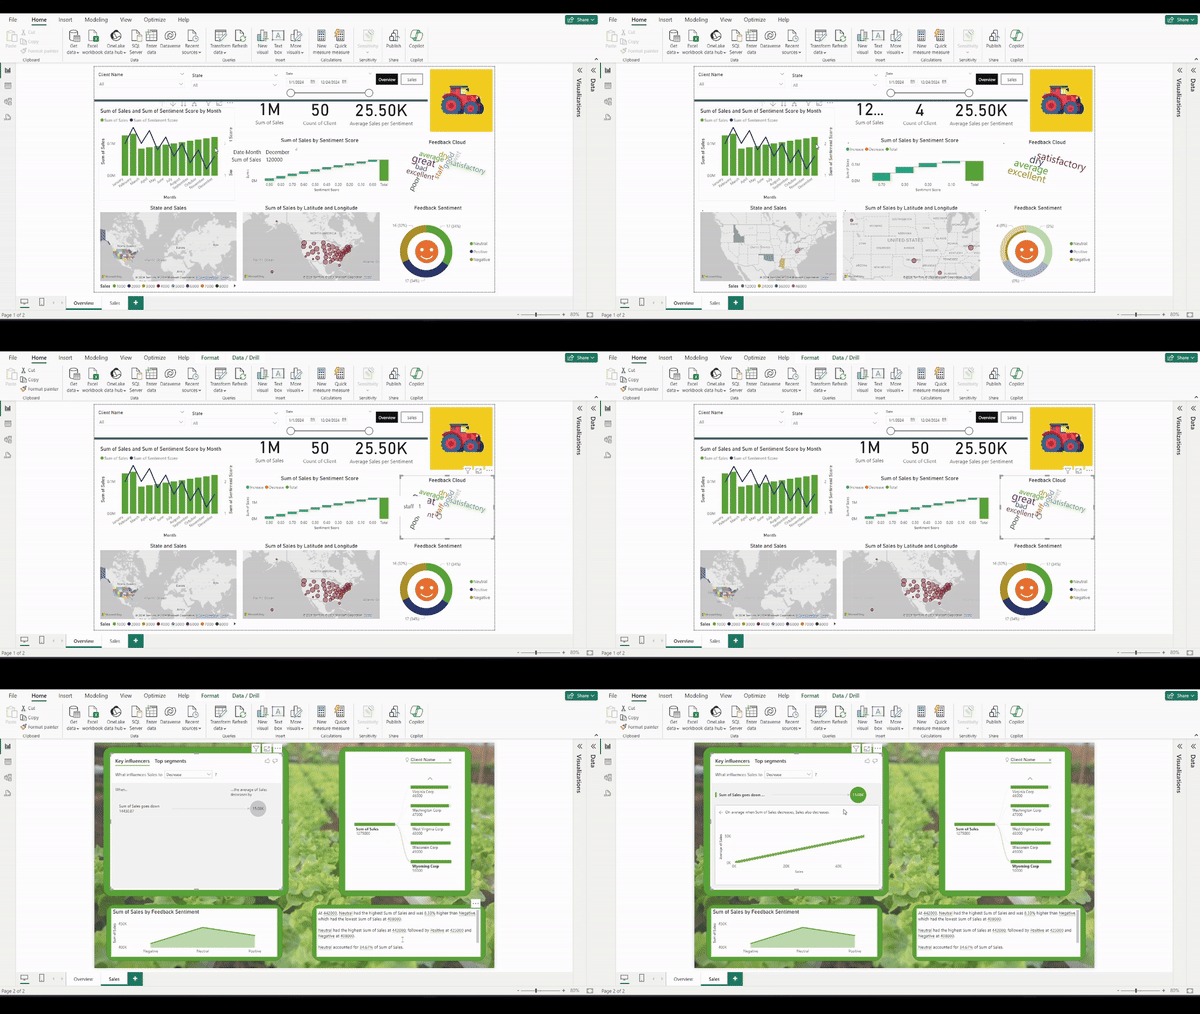
Explore my Power BI dashboard showcasing geo-statistics and crop data insights. Features include:
Cheat Sheet Guide
Quick
HTML
Word Cloud: Visualize feedback sentiment.
SVG Images and GIF Backgrounds: Engaging visuals.
Interactive Elements: Easy navigation and data filtering.

Quick Video Tutorial
Python Integration: Data manipulation and analysis.
DAX: Powerful calculations and measures.
AI Copilot: Enhanced data analysis with AI.
Discover insights from crop data with interactive pages like Overview and Sales. Dive in to see these features in action.
bottom of page